Skip Navigation

Food Pantry Use by Month

Stories

January 13, 2023

Total Number Of Households Using The Food Pantry Each Month

As we evaluate the Society of St. Vincent de Paul — Madison Food Pantry use month-by-month since 2019, we see a remarkable pattern.
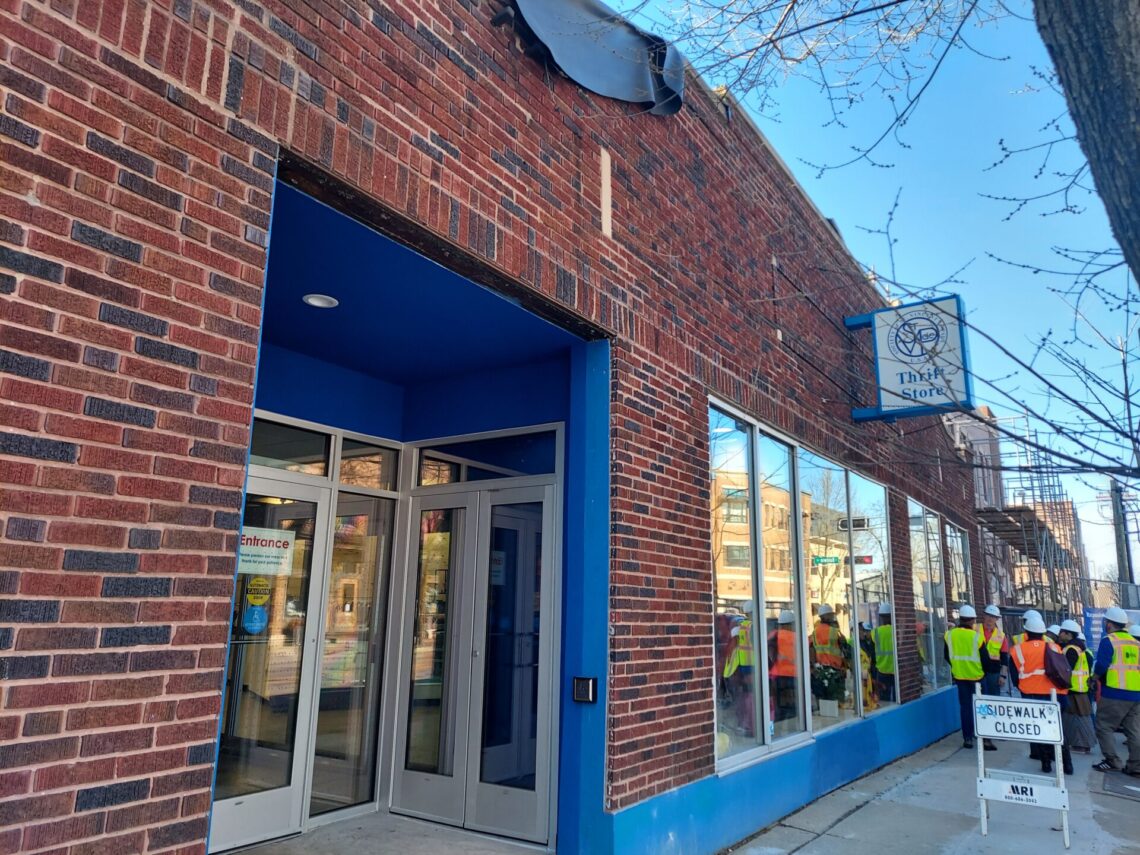
2019
  • Pantry use remained steady throughout the year (blue line).
2020
  • In 2020 (red line), pantry use reflected the changing landscape of the COVID-19 pandemic throughout its first year.
2021
  • In 2021 (yellow line), as federal funds – particularly advance child tax credit and stimulus payments – became available to families, pantry use dropped significantly to lower than historical use throughout the year. Presumably more people had money to provide for their family’s food needs.
2022
  • In January 2022 (green line), pantry use began where it left off the month before with an upward trend.
  • We had a record-breaking day with 205 families served on August 26 and eclipsed that record on September 29 with 215 families.
  • A slight dip in September followed historical trends, likely due to the return of children to school where breakfast and lunch are available to them.
  • October is traditionally our busiest month. Each Thursday in October set a new record.
  • November is generally a busy month at the pantry, with the days before Thanksgiving being some of the highest each year. Thursdays continued to be record-setting days through the Thursday before Thanksgiving becoming our then largest-ever day with 277 families.
  • Instead of tailing off in December as has been our history, we served the most households in a single month than ever before, with 2,568 households using the pantry that month.
2023
  • January 2023 (black line) was our largest-ever month, even though there were no record-setting days.
  • February had a slight dip, still far above even the high months of 2020, and likely had fewer visits due to the length of the month and three Thursdays (typically our busiest days) with blizzard-like conditions.
  • March jumped to 2,854 visits, the highest ever by more than 300 visits. This reflected the end of pandemic-era accelerated FoodShare benefits (SNAP) going back to pre-pandemic norms, a decrease in benefit of about $100 per person.
  • April still exceeded 2,450 visits for the month and reflected two fewer pantry days in April than in March, with an average of 153 visits per pantry day.
  • June hit a new high with 2,858 households served.
  • The new “normal” over the spring and summer months saw pantry visits landing between 2,600-3,000 per month.
  • The last four months of the year saw new pantry record days every month through December; peaking at 3,154 households in October.
2024
  • January 2024 (teal line) totaled 2,881 households even being closed for three days due to inclement weather.
  • February exceeded 3,100 visits in one month for the second time in our history.

Signup for our Newsletter